Net Operating Income Growth: How to Measure It Year Over Year
Net operating income growth compares this year's NOI to last year's on the same basis. Build a year over year walk and see where the income leaked.
By the NOICalculator.org team
Net operating income growth is the change in a property’s NOI from one twelve month period to the next, divided by the earlier period’s NOI. On the calculator’s default property, NOI rising from $28,892 to $29,758 is 3.0% growth, and NOI falling to $28,528 is a 1.3% reduction.

NOI growth is the cleanest read on whether a property got better or worse at its job. Because NOI sits above debt payments, income taxes and depreciation, a refinance cannot flatter it and a weak year cannot hide behind the loan. If the line itself is new to you, start with what net operating income is and come back.
What net operating income growth measures, and over what period
Compare twelve months against the matching twelve months. Rent, taxes and insurance each run on their own calendar, so a six month stretch set against a different six months mixes seasons and tells you almost nothing.
Only two inputs drive the number: income you actually collect and expenses you actually pay.
Growth can be positive while rent is flat, if you cut a cost. It can be negative while rent rises, which is the case most owners meet in practice, and the one the walk below exists to explain.
Same-property comparisons: keeping the basis honest
Retailers call this same-store sales. Real estate calls it same-property NOI, and it means comparing the same square feet, the same unit count and the same months of the year.
Four rules keep the basis honest.
- Compare actuals to actuals. A budget against last year’s real results is not growth, it is a hope. The gap between those two has its own page on pro forma NOI against actual NOI.
- Keep capital spending out of both years. A new roof is not an operating expense, and letting it into one year manufactures growth in the next.
- Use the same expense definitions. If reserves were 5% of collected income last year, they are 5% this year.
- Separate anything you added. A second building, a new unit, or pet rent on a lease that did not exist before is expansion, not same-property growth. Report it on its own line.
Building a simple year over year walk
A walk, also called an NOI bridge, lists each change between the two NOI figures so the total has a reason behind it. Build it in this order: last year’s NOI, the effect of rent changes, income lost to vacancy and credit problems, other income, each fixed expense change, variable expense changes, then this year’s NOI.
Here is the walk on the site’s default property. A $500,000 house rents for $4,000 a month, $48,000 a year. At 5% vacancy, effective gross income is $45,600. Taxes are $6,000, insurance is $2,500, and 18% of collected income, $8,208, covers maintenance, reserves and management. Operating expenses total $16,708 and NOI is $28,892, a 5.78% cap rate.
Now give it a realistic second year. Rent goes up 3% to $4,120 a month. Vacancy drifts from 5% to 7%, because one turnover took six weeks instead of two. Taxes rise $300 and the insurance policy renews $375 higher.
| Line | Effect on NOI |
|---|---|
| Year one NOI | $28,892.00 |
| Rent raised 3% | +$1,368.00 |
| Vacancy 5% to 7% | -$988.80 |
| Property taxes | -$300.00 |
| Insurance renewal | -$375.00 |
| Maintenance, reserves and management at 18% | -$68.26 |
| Year two NOI | $28,527.94 |
NOI growth is -1.3%. The owner raised rent 3% and still went backwards, and the walk names the culprit. Two points of vacancy cost $988.80, more than the tax and insurance increases put together.
That reduction costs value too. At the same 5.78% cap rate, $364 of lost NOI is roughly $6,300 off the price a buyer would pay.
Where income leaks: concessions, bad debt, vacancy drift
Income leaks are small and quiet, which is why they outrun rent increases.
Vacancy drift is the biggest one. It rarely arrives as an empty unit for a year. It arrives as a few extra weeks between tenants, repeated.
Concessions hide inside a rent number that looks fine. One free month on a $4,120 rent is $4,120, about 8.3% of the year’s scheduled rent. Half a month is still 4%.
Bad debt is rent you billed and never collected. Write it off in the year it happened, or next year’s comparison inherits the problem.
Renewals under market leak slowly. A tenant kept at $3,900 while the market moved to $4,120 costs $2,640 a year, and the taxes and insurance do not shrink to match.
Every one of those leaks lands in effective gross income, so the margin falls with the dollars. Tracking NOI margin alongside growth tells you whether a bigger NOI came from a better property or just a bigger one.
Where expenses creep: insurance, taxes, payroll, turnover
Insurance and property taxes move on schedules you do not control. A reassessment after a sale or a reappraisal can lift the tax line in one step, and premiums can jump at renewal after a few heavy loss years in a region. Both are market specific, so use your own renewal notice and tax bill rather than a general rate. For broader cost trends, the Bureau of Labor Statistics publishes the Consumer Price Index by category.
Payroll and property management fees creep more gently. Management is usually a percentage of collected rent, so the fee falls when collections fall, which masks part of the damage in the walk.
Turnover is the expense that pretends to be something else. Each move out means paint, cleaning, repairs and a leasing cost, plus the vacancy on the income side.
Watch the ratio and not only the dollars. If expenses grow faster than collected income for two years running, the operating expense ratio will show it before the NOI dollars look alarming.
Setting a target and checking it each quarter
A target for NOI growth is really two targets: a rent number and an expense number. On the default property, where expenses are 36.6% of collected income, 3% on both sides produces exactly 3% NOI growth. Hold rent at 3% and let expenses run 6%, and growth drops to 1.3%.
So write the target as a pair. For example, 3% rent growth with expenses held to 4%, and vacancy no worse than 5%.
Check it quarterly on a trailing twelve month basis, against the same trailing twelve months a year earlier. That smooths out the quarter when the tax bill lands and still catches a problem three quarters before the annual statement does.
When growth comes in short, read the walk before you touch the rent. For benchmarks, see what a good NOI percentage looks like, and for the levers themselves, how to increase NOI works through the options line by line.
Run both years through the calculator
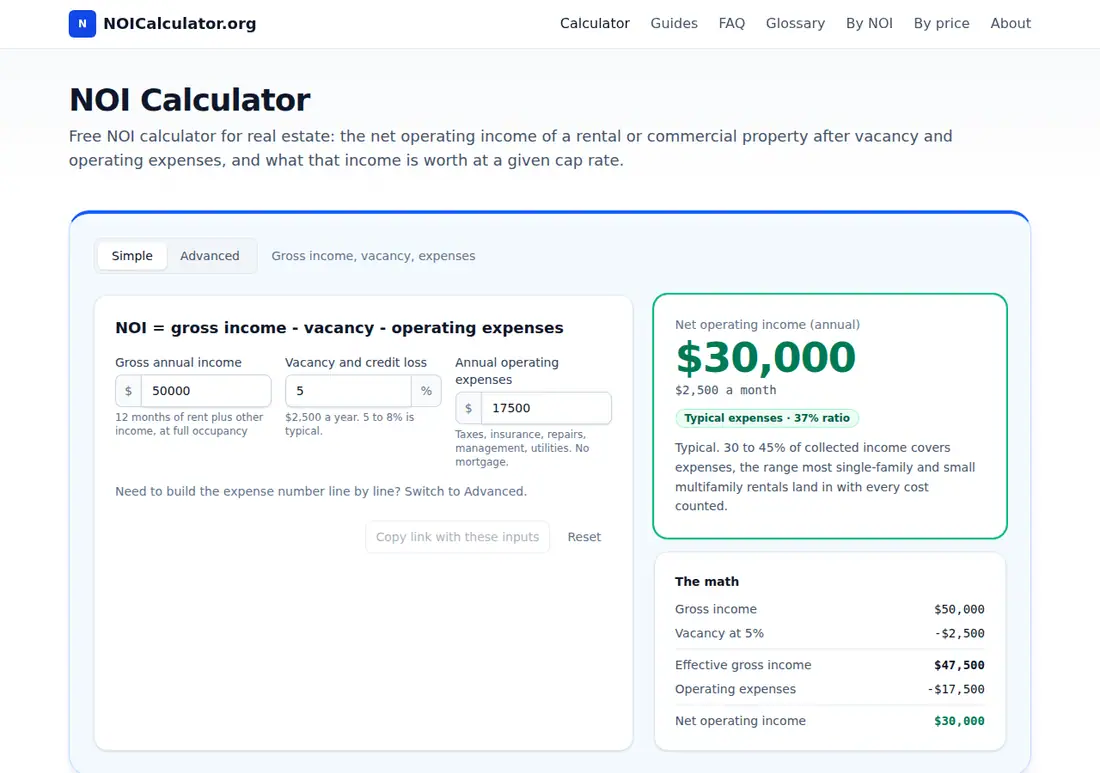
The fastest way to build the walk is to use the NOI Calculator on the home page twice. Enter last year’s rent, vacancy and expenses, write down the NOI, then enter this year’s and write that down. The difference divided by the first figure is your net operating income growth, and changing one input at a time shows you exactly what each line contributed.
Frequently asked questions
How do you calculate net operating income growth?
Subtract last year's NOI from this year's NOI, then divide the difference by last year's NOI. On the calculator's default property, NOI rising from $28,892 to $29,758 is 3.0% growth. Use twelve months against the matching twelve months, actual results on both sides, and the same expense definitions in both years, or the percentage measures your bookkeeping instead of the property.
What is an NOI bridge?
An NOI bridge, also called a walk, is a short list of every change between last year's NOI and this year's, with a dollar figure beside each one. It starts at the old NOI, adds rent increases, subtracts vacancy and credit losses, subtracts each expense change, and lands on the new NOI. Nothing is left unexplained, so you can see which line caused the move.
What causes a reduction in net operating income?
Usually vacancy drift, concessions or bad debt on the income side, and insurance renewals, property tax reassessments, payroll or turnover costs on the expense side. Rent can rise 3% and NOI can still fall, because fixed costs do not shrink when collections slip. Two points of extra vacancy on the default property cost $988.80, more than its tax and insurance increases combined.
What is a good NOI growth rate?
There is no single figure, because it depends on rent growth and expense inflation in your market. The arithmetic sets the bar. On the default property, where operating expenses are 36.6% of collected income, income and expenses both rising 3% gives exactly 3% NOI growth. If income rises 3% while expenses rise 6%, growth falls to 1.3%.