Stabilized NOI, Adjusted NOI and Forward NOI: Which Version Are You Looking At?
Stabilized NOI, adjusted NOI and forward NOI (NTM or FTM) can differ by 40% on one house. How each version is built, and which one to price a deal on.
By the NOICalculator.org team
Stabilized NOI, adjusted NOI and forward NOI are three answers to the same question about one building, and brokers quote them as if they were one number. A listing says stabilized NOI is $34,820. The lender’s file says adjusted NOI is $28,892. The offering memo shows NTM NOI, and the appraisal uses last year’s annual NOI. Same house, four figures. Each version starts from what net operating income measures and then changes one thing: the occupancy assumption, the expense list, or which twelve months you are counting.
Two abbreviations before anything else. NTM NOI means next twelve months. FTM NOI means forward twelve months. In real estate they point at the same idea, the year ahead. TTM, trailing twelve months, is the year behind.
The plain NOI on last year’s statement
Start with the actual number. Take the twelve months that just closed, use the rent that was collected and the bills that were paid, and subtract. This is what shows up on an operating statement or a T-12 from the seller’s bookkeeper. Nothing is assumed.
Take the site’s default property: a $500,000 house renting for $4,000 a month. Say the tenant left and the place sat empty for two months before the next lease started. Collected rent was $40,000, not $48,000. Taxes were $6,000, insurance $2,500, and 18% of collected income, $7,200, covered maintenance, reserves and management. Operating expenses came to $15,700 and actual NOI was $24,300, a 4.86% cap rate on the price.
That is a true number. It is also a poor guide to next year, because the two empty months were a one-time event. Annual NOI is the standard unit for every version below, though dividing by twelve works fine if you want it monthly instead of annually.
Stabilized NOI: the number once the building is full
Stabilized NOI is what the property earns at normal occupancy, after lease-up, renovation or a run of turnover is finished. You replace the real vacancy with the vacancy a steady building in that market would run.
Do that here and the two empty months disappear. Gross scheduled income is $48,000, vacancy 5%, effective gross income $45,600. Taxes $6,000, insurance $2,500, and 18% of collected income, $8,208, for maintenance, reserves and management. Operating expenses total $16,708 and stabilized NOI is $28,892, or $2,407.67 a month. That is a 5.78% cap rate. The steps in the calculation never changed. Only the vacancy input moved.
The honest part of stabilized NOI is that nobody prices a building on one bad year. The soft part is the vacancy rate someone picks. Stabilized vacancy depends on the submarket and the property type, and the basis should be local: what similar rentals nearby actually run, not a round number that flatters the listing. 5% on a single-family house in a steady area is reasonable. 5% on a property that has turned over three times in two years is a sales pitch.
Adjusted NOI and the add-backs people make
Adjusted NOI is NOI with items taken out or put back by hand. Every adjustment needs a reason you can say out loud.
Defensible ones: removing a one-time legal bill, removing a storm repair that insurance reimbursed, removing an owner’s personal expense that ran through the property account.
The ones that inflate the number: adding back management because the seller self-manages, dropping the reserve line because nothing broke last year, keeping the seller’s old insurance premium after a renewal quote came in higher.
Watch what two of those do. Remove the 8% management fee, $3,648, and NOI goes from $28,892 to $32,540, a 6.51% cap rate. Drop the 5% reserve line too, another $2,280, and you reach $34,820, a 6.96% cap rate. Neither change touched the building. The next owner still has to manage it and still has to replace the roof. Most of these moves come out of the same habits as a seller’s projection, so the gap between pro forma and actual NOI is worth reading before you accept an adjusted figure.
Forward NOI: the next twelve months instead of the last
Forward NOI covers the year ahead. It uses leases already signed, scheduled rent increases, and the expenses you expect to pay in the coming year.
On the default house, suppose the lease renews at $4,150 a month, $49,800 a year, insurance renews at $2,750, and taxes reassess to $6,180. At 5% vacancy, effective gross income is $47,310. Expenses are $6,180 plus $2,750 plus 18% of collected income, $8,515.80, for $17,445.80 in total. NTM NOI is $29,864.
NOI growth is the gap between the two years: $28,892 to $29,864 is about 3.4%. Growth comes from rent rising faster than expenses. It runs backward just as easily. A jump in taxes or an insurance renewal with flat rent shrinks NOI even when every unit stays full.
How much the versions differ on the same building
Four numbers, one house:
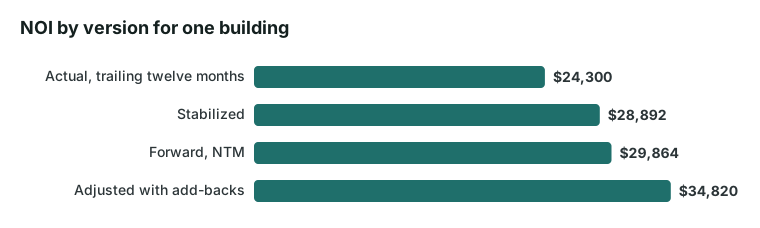
| Version | NOI | Cap rate at $500,000 |
|---|---|---|
| Actual, trailing twelve months | $24,300 | 4.86% |
| Stabilized | $28,892 | 5.78% |
| Forward, NTM | $29,864 | 5.97% |
| Adjusted with add-backs | $34,820 | 6.96% |
Lowest to highest is a spread of $10,520, about 43% above the trailing figure. Price those two at a 6.5% cap rate and the building is worth $373,800 on the trailing number and $535,700 on the adjusted one. That is a $161,900 swing produced by labels, not by the property.
Which one to use when you are pricing a deal
Build your own version. Start from the seller’s actual twelve months, because that is the only one with evidence behind it. Put back whatever was stripped out: management at a market rate even if you plan to self-manage, reserves, your own insurance quote. Set vacancy to what the area supports. Then add only the increases you can prove from signed leases.
Use the actual number to test claims, the stabilized number to compare buildings against each other, and the forward number for loan sizing and your first year budget. When a quoted NOI sits far above yours, find the single line that explains the difference. If it is a genuine one-time event, fine. If it is a cost the next owner still pays, that belongs in the price.
Run each version yourself
The NOI calculator handles all four in a couple of minutes. Enter the actual year, save the result, then change vacancy for the stabilized version and the rent and expense lines for the forward version. Its simple tab is faster if you already know the totals: $50,000 of gross income, 5% vacancy and $17,500 of expenses gives NOI of $30,000.
Frequently asked questions
What is stabilized NOI in real estate?
Stabilized NOI is what a property earns at normal occupancy, once lease-up, renovation or a run of turnover is behind it. You swap the real vacancy for the vacancy a steady building in that submarket runs. On the site's default house, that means 5% vacancy, $45,600 of effective gross income, $16,708 of operating expenses and NOI of $28,892.
What does adjusted NOI mean?
Adjusted NOI is NOI with items removed or added back by hand. Taking out a one-time legal bill or a storm repair that insurance covered is fair. Adding back the management fee because the seller self-manages, or dropping reserves because nothing broke last year, is not. On the default house those two add-backs lift NOI from $28,892 to $34,820 without changing the building.
What does NTM NOI mean, and what is FTM NOI?
NTM NOI means next twelve months. FTM NOI means forward twelve months. Both describe the year ahead, built from signed leases, scheduled rent increases and the expenses you expect to pay. TTM, trailing twelve months, is the opposite: the year that just closed, using rent actually collected and bills actually paid. Ask which one a quoted figure is before you compare it to anything.
How do you calculate NOI growth?
NOI growth is the change in NOI from one twelve month period to the next, stated as a percent. Take the default house at $28,892 of stabilized NOI. If the lease renews higher and taxes and insurance also rise, next year's NOI works out to $29,864, which is growth of about 3.4%. Expenses rising faster than rent produce negative growth.